Looking to invest in a short-term rental property? Use STRProfitMap to analyze deals and find profitable Airbnb investments—then let Vacation Rental License handle the licensing process from start to finish.
Most Airbnb data tools analyze every listing: abandoned properties, seasonal hobbyists, listings with two reviews. Then they call it “market data.” You make a $100K+ decision on it.
STRProfitMap takes a different approach. We filter down to reliable listings only, properties with proven track records, consistent bookings, and real revenue history. The noise is gone before you ever see a number.
The result: data you can actually underwrite with confidence.

Research markets, underwrite properties, check regulations, and build your deal pipeline. One platform, no spreadsheet gymnastics.
Paste an address. Get revenue projections, cap rate, cash-on-cash, DSCR, expense breakdowns, and nearby comps in under two minutes.
The Property Analyzer pulls weighted comparables from nearby reliable listings and runs full financial modeling: four revenue scenarios (conservative to top performer), automated expense calculations, and multi-year investment projections. Every number is backed by real rental data, not industry averages from a blog post.
FROM ADDRESS TO UNDERWRITING IN TWO MINUTES
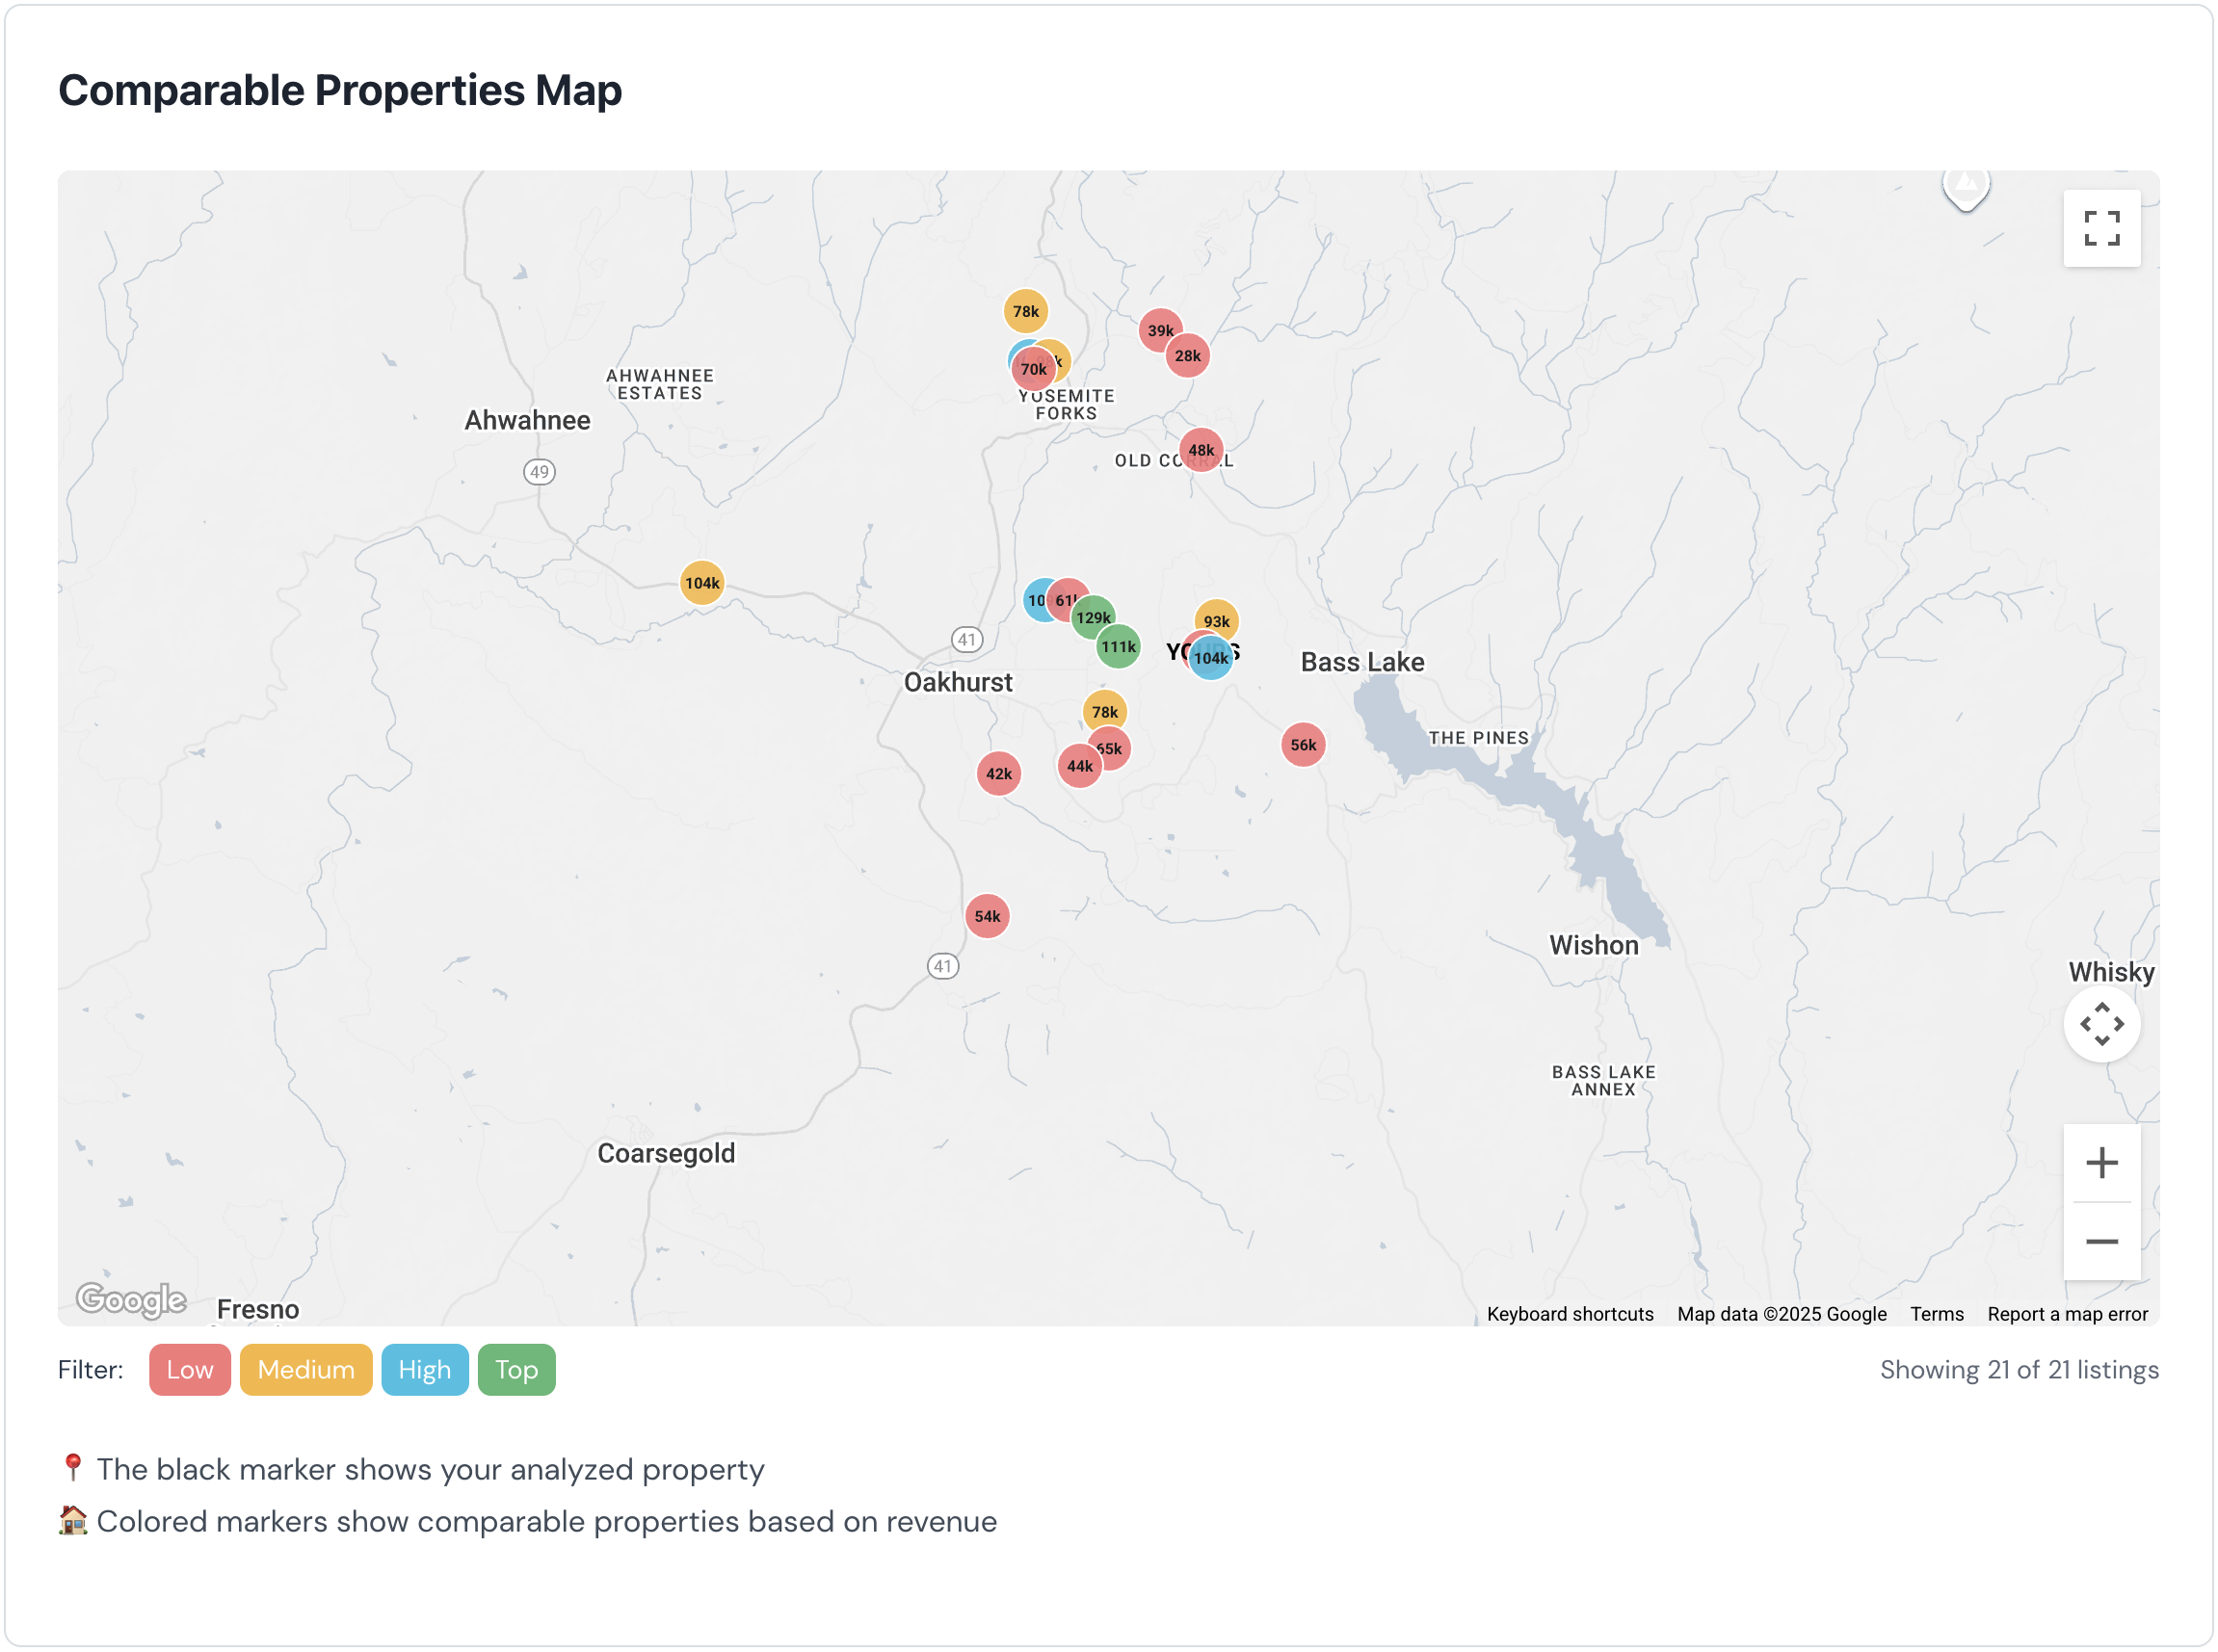
Revenue ranges, financial metrics, comps, and projections in one view
Revenue trends, occupancy shifts, ADR patterns, supply growth, and a proprietary saturation score across 5,588 cities.
Market Analytics gives you the full operating picture: 9 performance charts covering monthly revenue, occupancy, and ADR trends against prior year, supply growth trajectories, revenue distribution by bedroom count, and performance tier breakdowns comparing what top, middle, and bottom earners actually generate. Plus a Market Saturation Score (0 to 12) that flags when a market is approaching oversupply, so you see the risk before you are in it.
TRENDS TELL YOU WHAT SNAPSHOTS HIDE
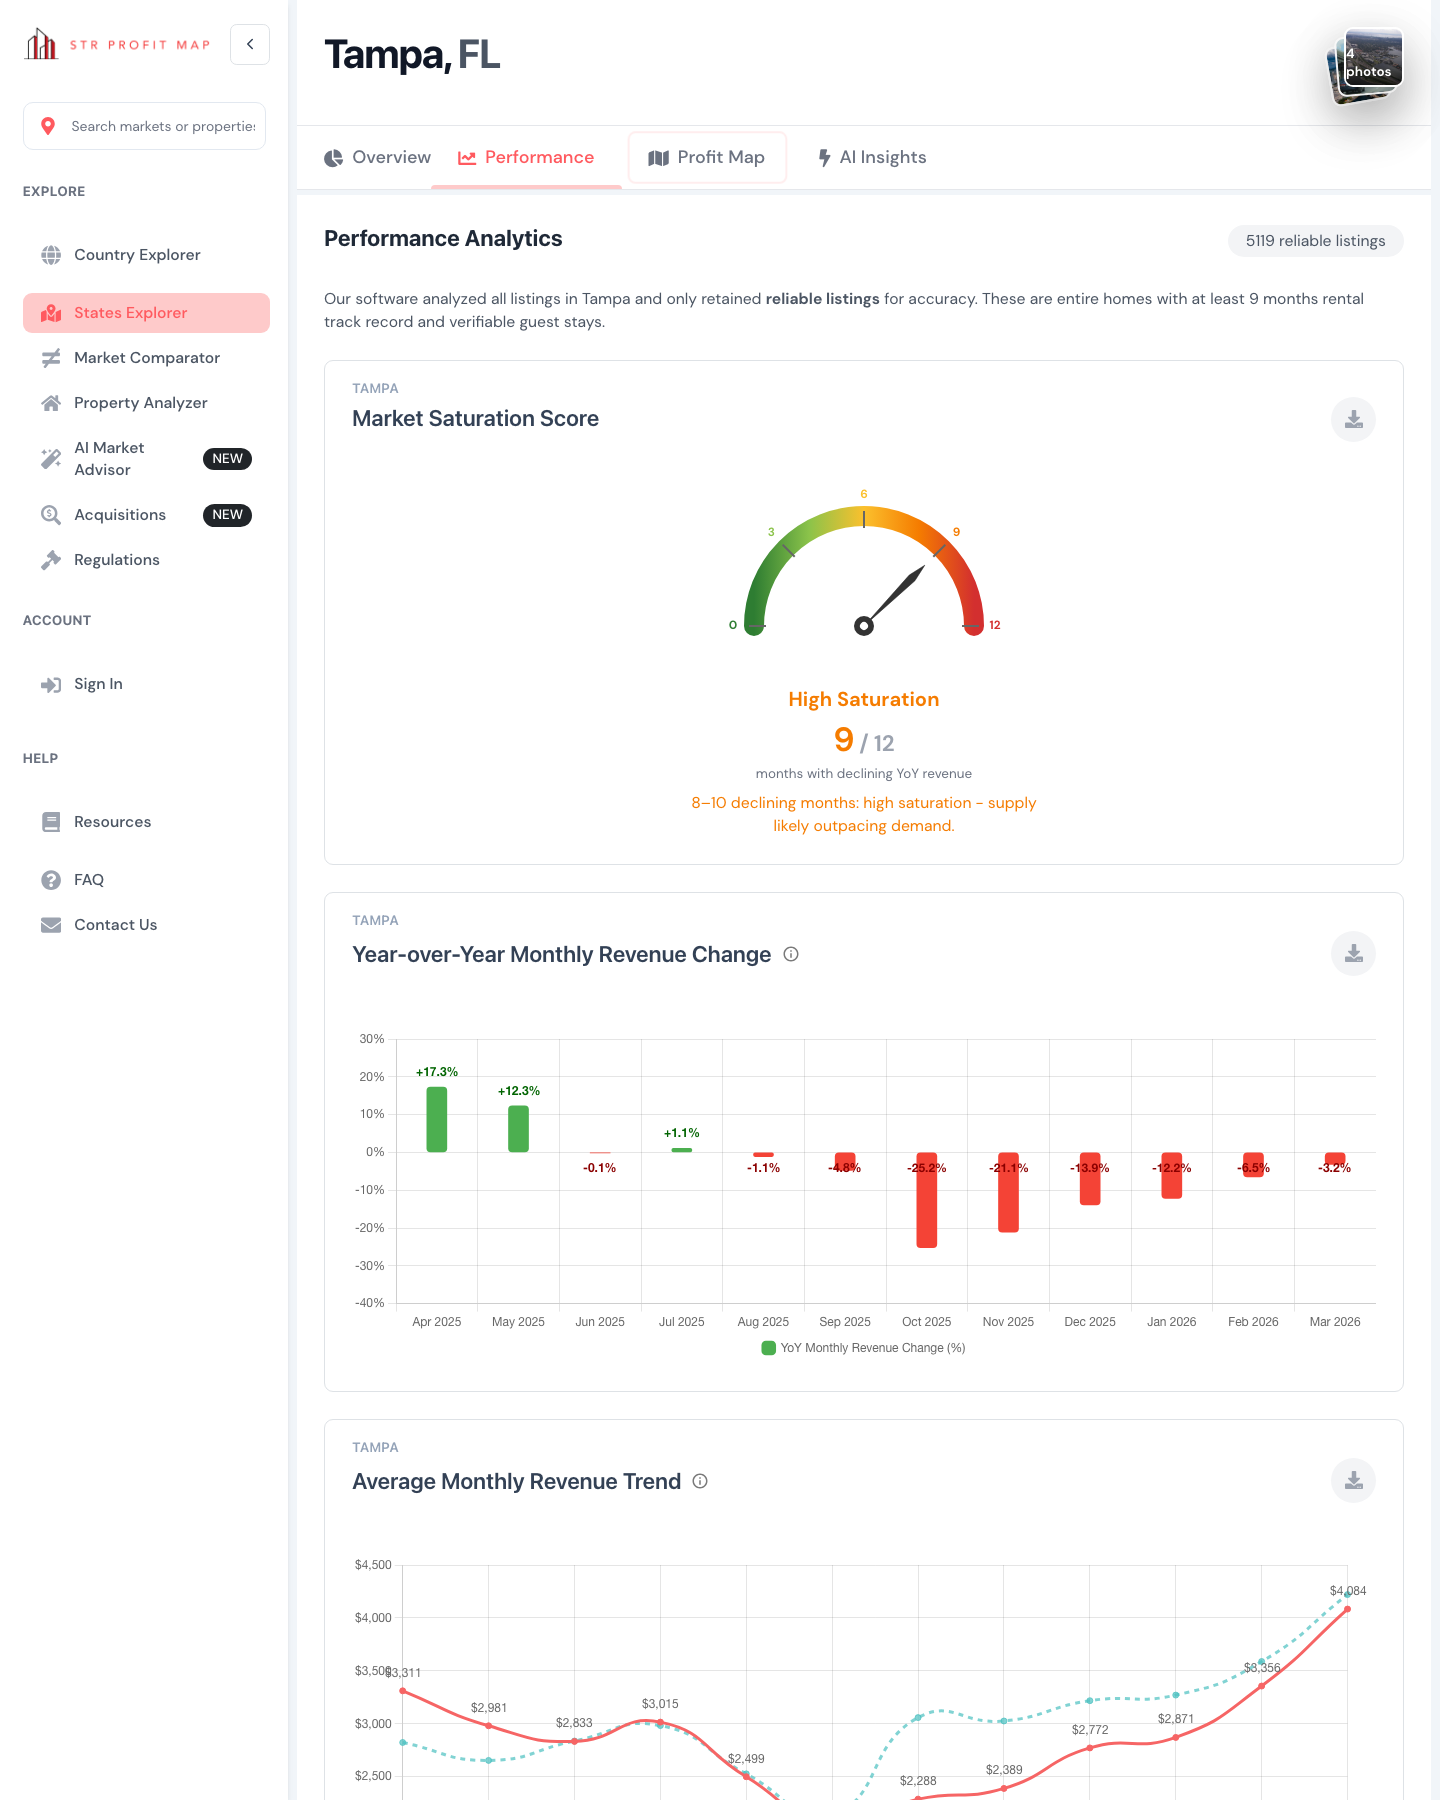
Revenue, occupancy, ADR, saturation, and supply growth for 5,588 cities
Interactive maps color-coded by revenue tier show you exactly where top-performing STRs cluster inside any market.
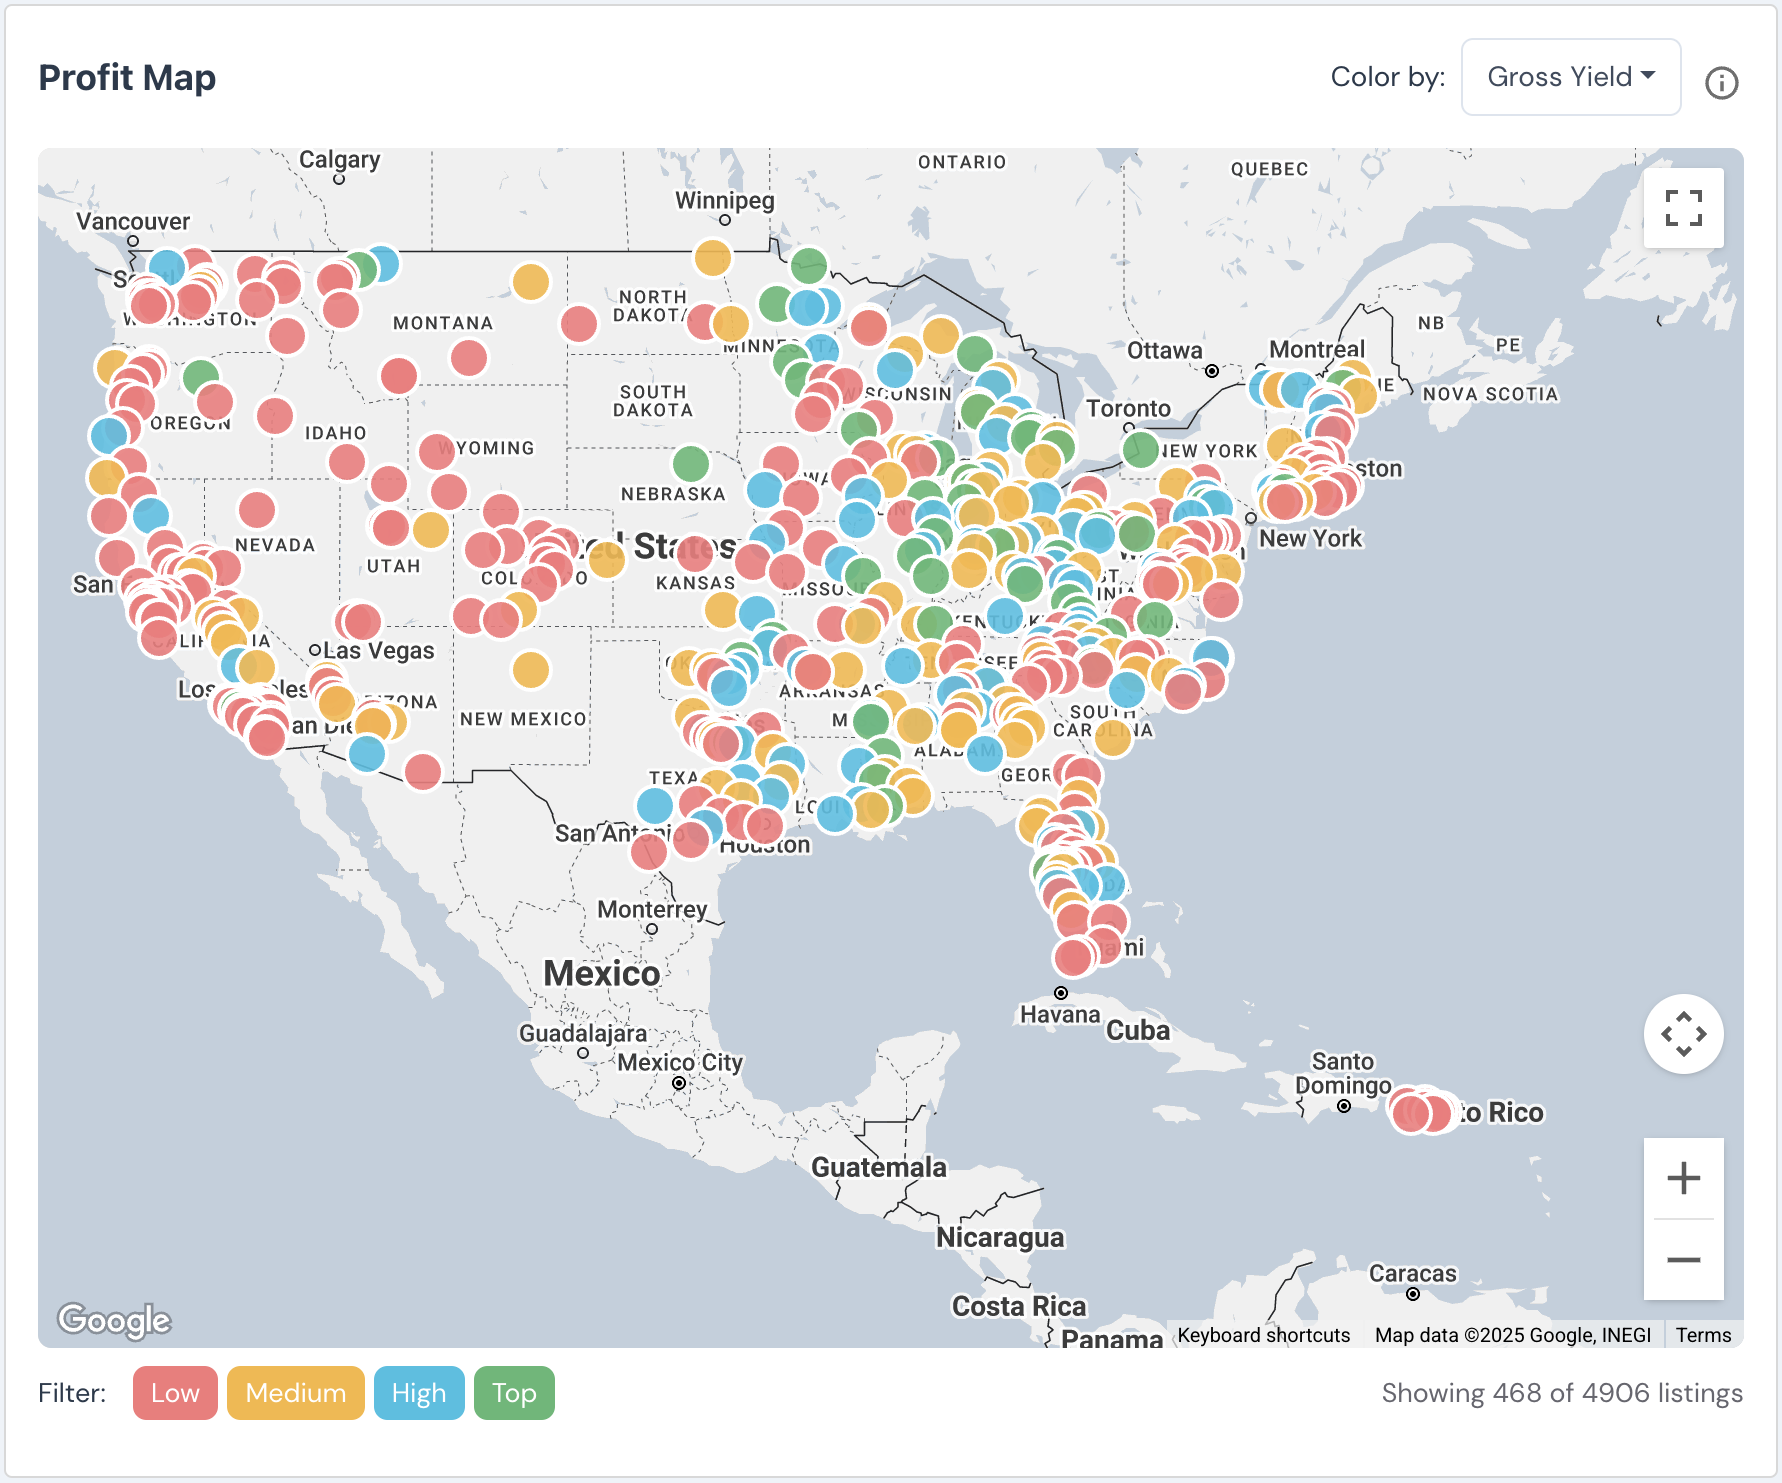
Profit Maps plot every reliable listing on a Google Maps overlay, color-coded by revenue performance: low, medium, high, and top tier. Filter by bedroom count. Click any pin for individual listing data. Load nearby markets to expand your search radius. This is how you go from "I like this city" to "I want to buy on this street."
STREET-LEVEL CONVICTION, NOT CITY-LEVEL GUESSING
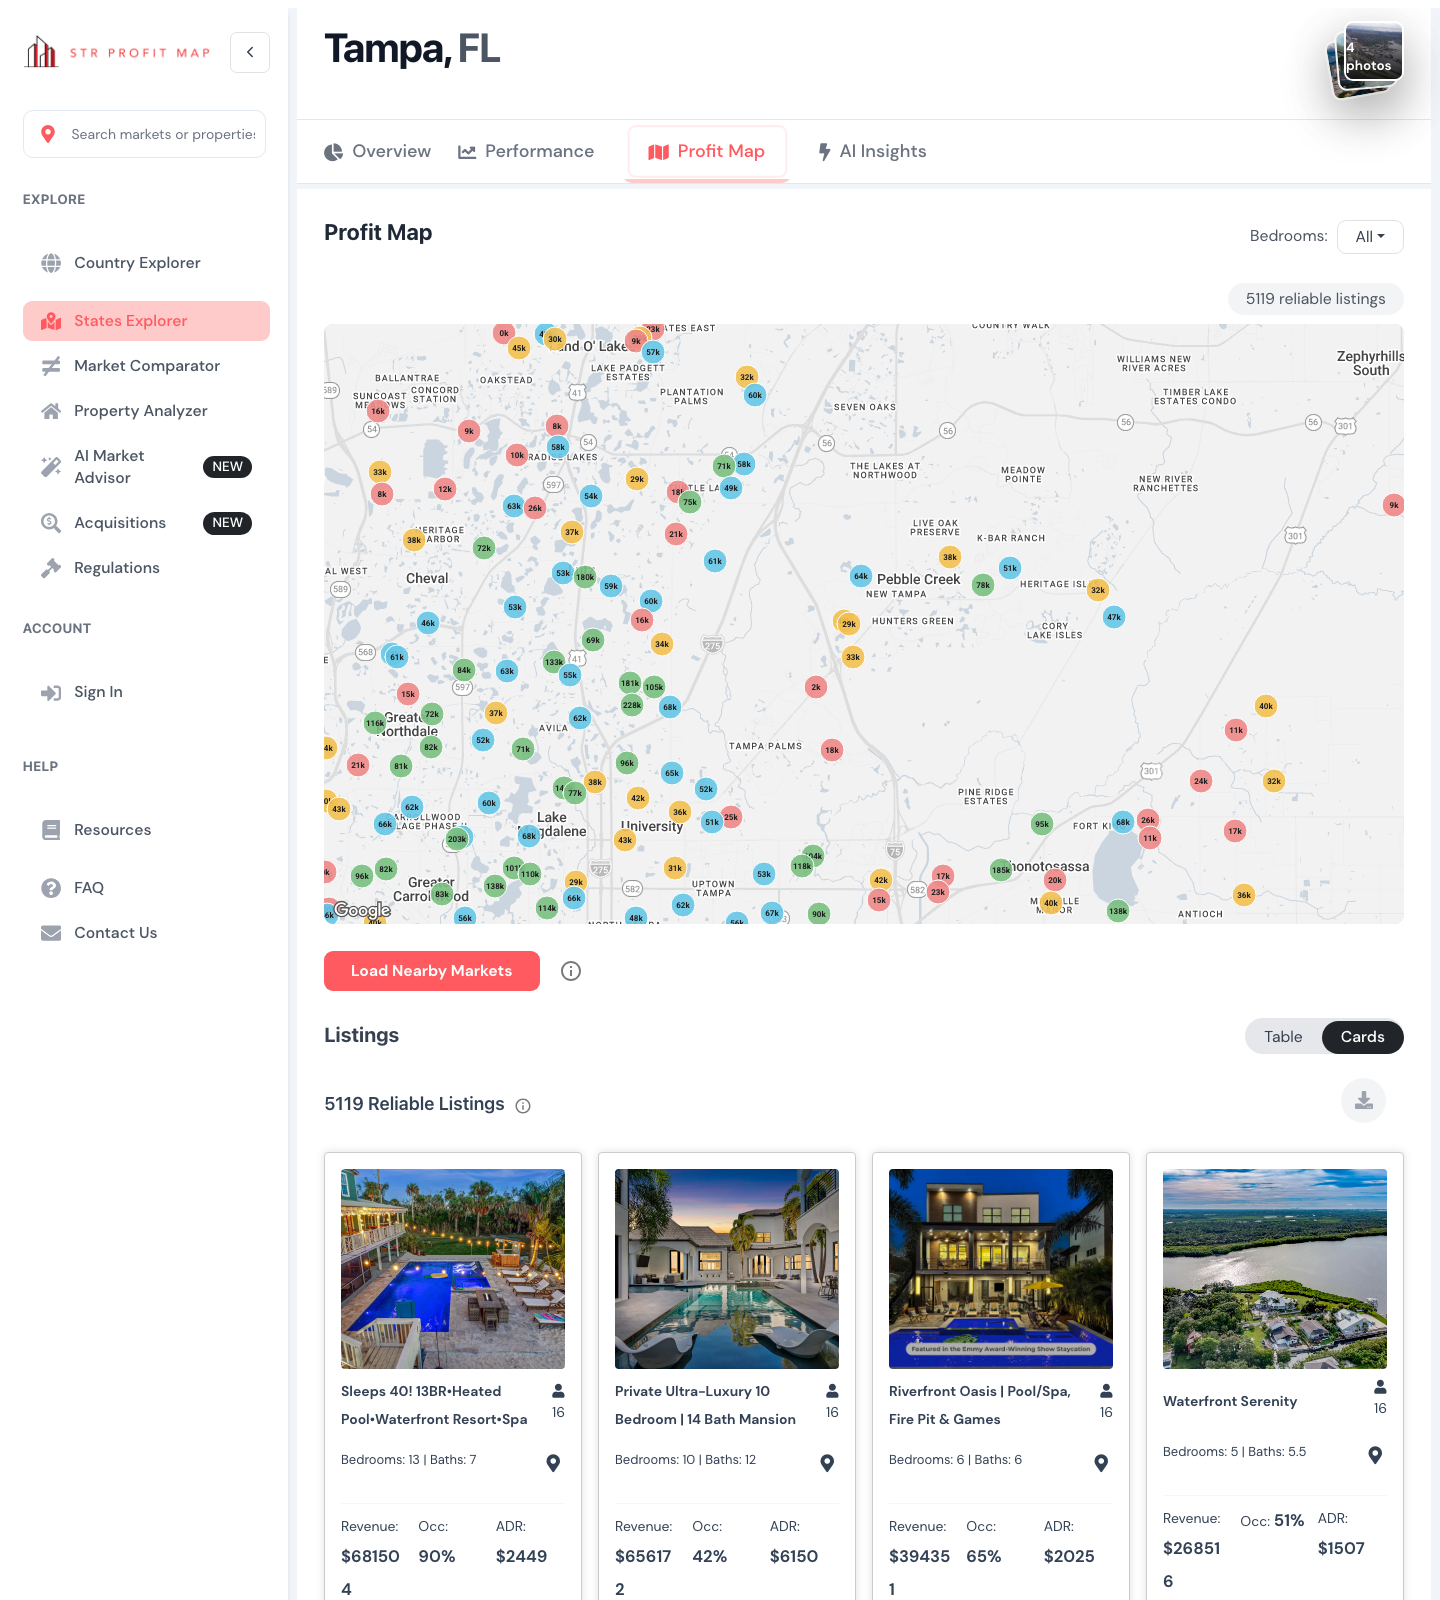
Every reliable listing mapped and color-coded by revenue performance
Define your target price range, return threshold, market, and property type once. Let matching deals come to you.
Buy Boxes let you codify your investment thesis into clear, repeatable criteria: target markets, minimum cap rate, revenue floor, bedroom count, home price ceiling. When new listings hit the platform, your buy box filters them automatically so you spend time on deals that fit, not deals that feel interesting but fail the math.
COMING SOON: YOUR THESIS, AUTOMATED
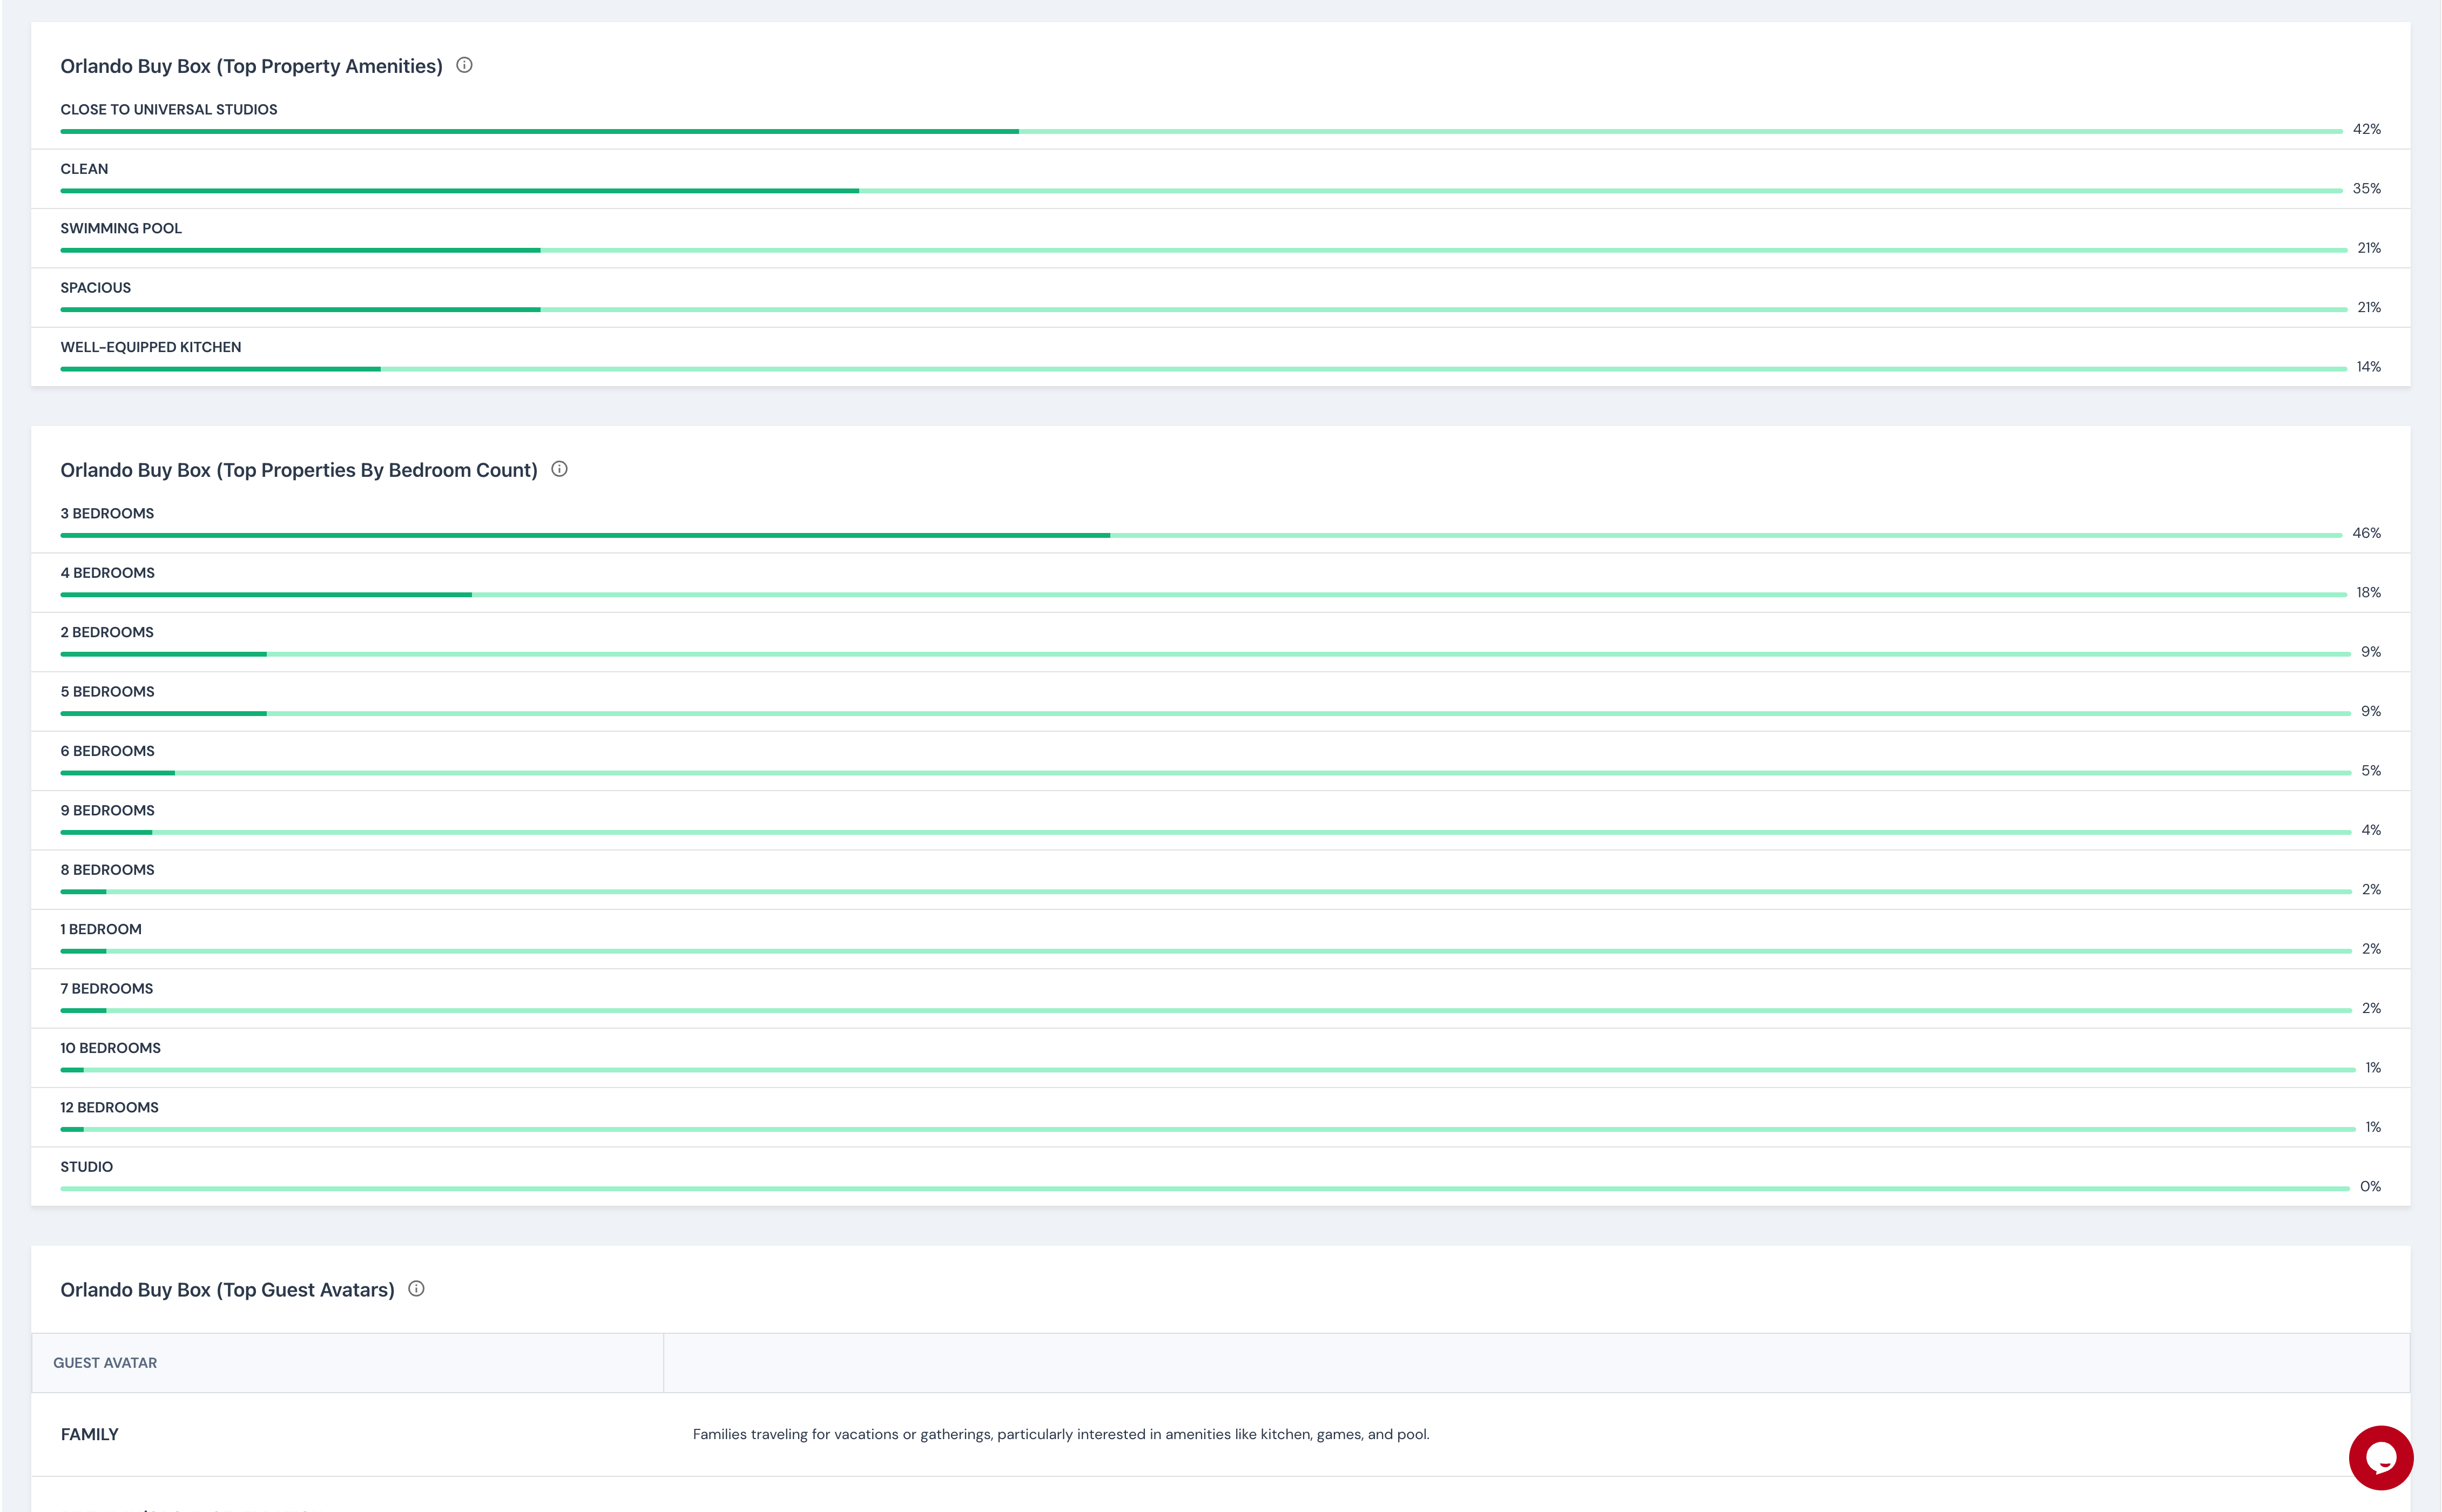
Define once, filter continuously, review only what fits
Browse every US STR market from one screen. Sort by cap rate, revenue, occupancy, or home value. Build your shortlist before you go deep.
Country Explorer gives you card and table views of 5500+ US markets (covering 20000+ cities) with six KPIs per market: listing count, cap rate, median revenue, occupancy, average home value, and ADR. Filter by state, sort by any metric, and use the interactive profit map to spot high-yield clusters visually. Go from 5,588 options to a shortlist of 5 in one session.
5,588 MARKETS. ONE SCREEN. YOUR SHORTLIST.
National discovery that gets you to conviction faster
STRProfitMap's AI Advisor answers natural-language questions about any market using live revenue, occupancy, saturation, and regulation data from 5,588 cities.
Type a question like "What are the best mountain markets under $400K that are not oversaturated?" and get ranked results with real numbers: revenue, cap rate, saturation score, regulation grade, and direct links into the full market analysis. The AI Advisor is powered by STRProfitMap's complete dataset, not generic internet knowledge. Every answer includes the data behind it.
REAL ANSWERS FROM REAL DATA
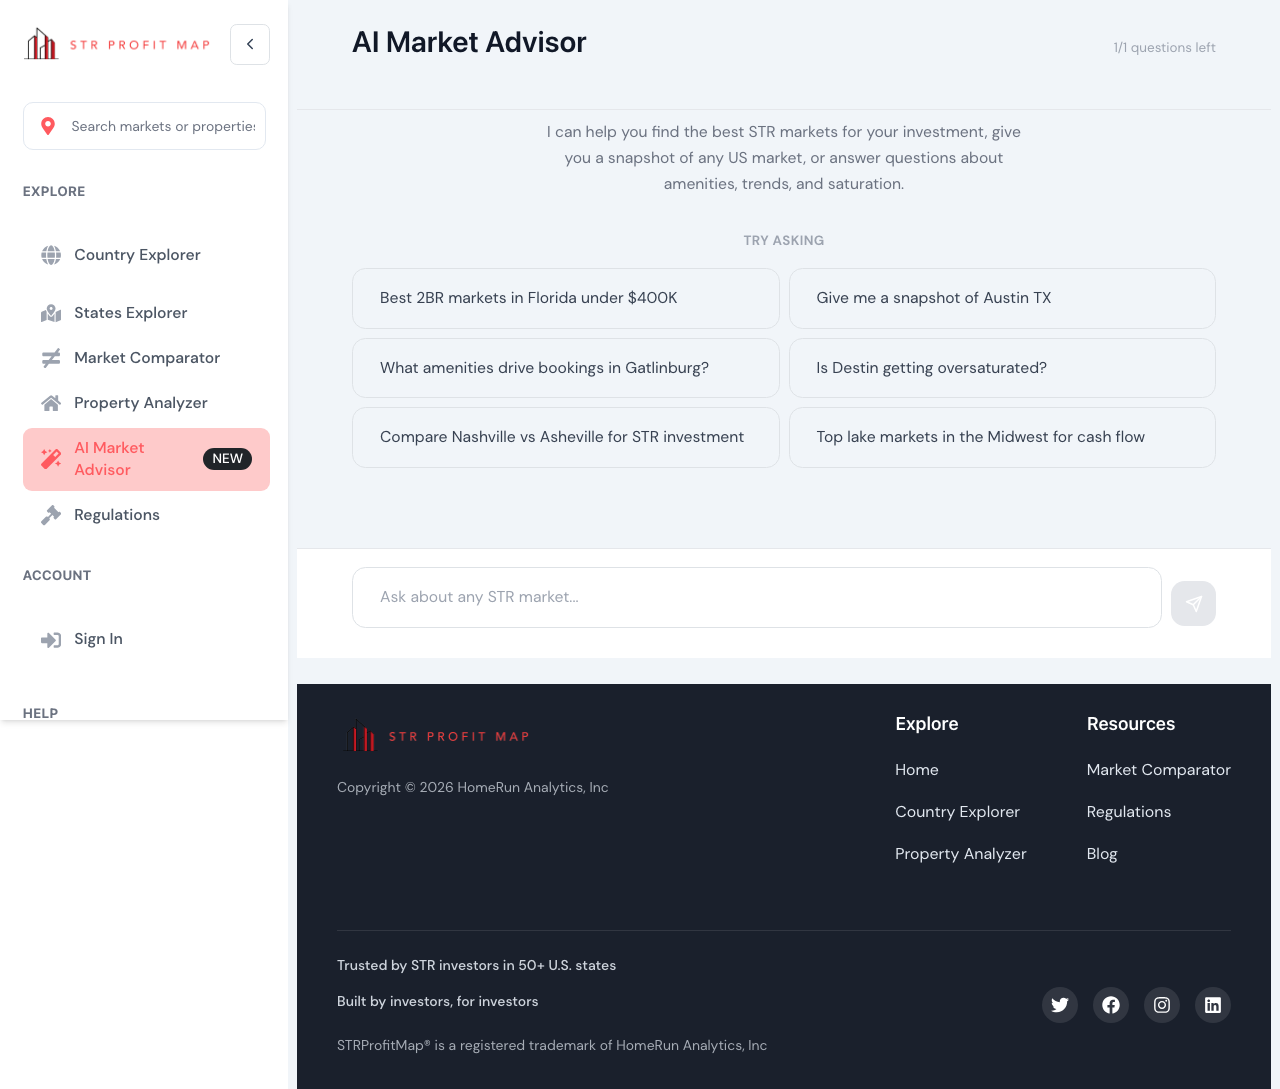
Market intelligence in plain language, backed by 5,588 cities of STR data
Check permit requirements, fees, tax obligations, occupancy limits, and investor-friendliness ratings before you spend a dollar on due diligence.
STRProfitMap maintains the most comprehensive short-term rental regulation database in the country, covering more US markets than AirDNA, Mashvisor, or any competing platform. Every market includes an investor-friendliness rating, permit and licensing requirements, fee schedules, tax obligations, occupancy and operational rules, and a plain-language regulatory summary.
SCREEN LEGAL RISK BEFORE YOU UNDERWRITE

The most complete STR regulation coverage in the US, updated and searchable
Start free, upgrade when you're ready, and run acquisition decisions on a platform designed for serious operators.


I was the knowledge and efficiency of this group. The team took care the licensure and dealing with the county...

Great company to deal with they took care of entire process and keep me informed at all times
Super professional team that knows how to get short term rental licenses fast! Highly recommend...
I have had excellent attention. He investigated everything calmly and let me know, according to my county...
Joana has been so helpful in every step of the process in obtaining the Vacation Rental License. She is very knowledgeable...
Guy is an expert in his field. I really appreciate the knowledge, competence and friendliness of his entire staff...
Very professional and reliable service. Walked me thru the entire process and got me the license. Best customer service!
Guy did an outstanding job! He was fast and efficient and very professional.
I will be recommending him to all of my...
Highly recommended!! VRL team did a great job, my rental property god licensed in a week or so. The process was super...
Clear , smooth , cheap and fast . Joana Bugtong is excellent. She always gives updates timely. Highly recommended!!
Explore our latest articles to help you make smarter STR investment decisions
Everything you need to know about our platform

Everything. One subscription unlocks all 20,000+ US markets across all 50 states. That includes revenue data, occupancy rates, average daily rates (ADR), home values, cap rates, cash-on-cash returns, market saturation scores, and individual property-level metrics with listing links. You also get the Property Analyzer (revenue estimates at P25/P50/P75/P90), AI Buy Box insights that show which amenities and bedroom counts drive the most revenue in each market, performance analytics with year-over-year trends, and full data export to CSV or Excel. Free accounts get 3 property analyses per day.
We aggregate data from public listing sources across major STR platforms including Airbnb and VRBO. Revenue, occupancy, and ADR data are updated weekly. Property valuations come from a third-party provider that assesses current market values for each active STR address, updated monthly. This is not scraped blog data or estimates from a model. It reflects actual booking performance from real properties.
9:50 – 10:40 am
6:00 – 7:30 pm
7:30 – 8:20 am
11:00 – 11:50 am
5:30 – 6:20 pm
11:00 – 11:50 am
7:30 –8:20 am
7:30 – 8:20 am
9:50 – 10:40 am
6:20 – 7:10 pm
10:20 – 11:10 am
8:00 – 8:50 am
11:30 – 12:20 pm
A reliable listing has at least 9 months of consistent operation, regular bookings, and real guest reviews. We apply this filter before you ever see a number. Why it matters: most platforms include every listing, even ones that were active for two months then abandoned, or seasonal hobbyists renting out a spare room three weekends a year. Those listings dilute the metrics and make it harder to get an accurate read on a market. When you see a revenue figure on STRProfitMap, it reflects what serious, consistent operators actually earn.
Most competitors analyze every listing regardless of quality. A property with 2 reviews that has been active for 2 months gets the same weight as a top performer with 5 years of history. Their metrics are diluted by dead listings, seasonal hobbyists, and abandoned properties. STRProfitMap filters down to reliable listings only before calculating any metrics. The result: when you see revenue, occupancy, or cap rate numbers on our platform, they reflect what serious operators actually earn, not a diluted average that obscures real market performance.
Yes. Revenue figures on STRProfitMap include cleaning fees to stay consistent across hosts, since cleaning fee structures vary widely (some hosts charge high cleaning fees with lower nightly rates, others bundle everything into the nightly price). Including them gives you a complete picture of what each property actually generates.
Revenue percentiles show how properties perform across the earnings spectrum in a given market:
P25 (Lowest Earners): Bottom 25% of reliable listings by revenue.
P50 (Middle Earners): The median. Half of reliable listings earn more, half earn less.
P75 (Mid-High Earners): Top 25%. These are strong performers with solid operations.
P90 (High Earners): Top 10%. Achievable with a well-located, well-managed property and the right amenities.
You can toggle percentiles at the market level, by bedroom count, or for individual properties. This lets you underwrite conservatively (P50) or see what top operators pull in (P90).
These are the core financial metrics investors use to evaluate deals:
Cap Rate: Annual net operating income divided by property value. A quick profitability indicator. Higher means better return relative to price.
Cash-on-Cash (CoC): Annual pre-tax cash flow divided by the total cash you invested (down payment, closing costs, rehab). Shows what your actual money earns.
NOI (Net Operating Income): Gross revenue minus operating expenses (cleaning, maintenance, management, supplies, insurance). Does not include mortgage payments.
DSCR (Debt Service Coverage Ratio): NOI divided by annual mortgage payments. A DSCR above 1.0 means the property covers its own debt. Lenders typically want 1.25 or higher.
The Property Analyzer calculates all of these automatically for any address you enter.
Yes. You can explore any market page and browse real data in preview mode. Free accounts also get 3 property analyses per day through the Property Analyzer, where you can enter any US address and see revenue estimates, financial projections, and comparable properties. No credit card needed to start. For a guided walkthrough, click "See Demo" on the homepage to see a sample market with full data.
We cover 20,000+ markets across all 50 states, but market boundaries follow how Airbnb and VRBO define them, not city limits or zip codes. Your area may be listed under a nearby city or a broader regional name. Try searching for surrounding towns or the county name. If you still can't find it, reach out to us at support@strprofitmap.com and we will investigate.
Yes. Premium subscribers can export market data to CSV or Excel from any market page. Each export includes revenue, ADR, occupancy, listings count, and more. You get two export options per market: "All Listings" and "Reliable Listings Only," so you can compare the full dataset against filtered data. Zip code level analytics are also available for drilling into specific neighborhoods.
Go to strprofitmap.com/analysis/property-analyzer and enter the property address. You will see seven sections: revenue estimates across four percentile bands (P25/P50/P75/P90), financial metrics (NOI, cap rate, CoC, DSCR), a full expense breakdown, a comparables map showing nearby STRs, an editable comparables table, and a multi-year investment projection with adjustable assumptions for appreciation, rent growth, and expenses. Free accounts get 3 analyses per day.
Yes. Cancel anytime from your account settings under "Manage Subscription." There are no contracts, no cancellation fees, and no auto-renewal after you cancel. Your access continues through the end of your current billing period. If you run into any issues with the cancellation process, email us at support@strprofitmap.com and we will handle it immediately.

.png)